 |
|||||||||||||||||||||||||||||||||||||||||
|
Home : Matrix Method : Modeling Trinity |
|||||||||||||||||||||||||||||||||||||||||
 |
|||||||||||||||||||||||||||||||||||||||||
|
The Matrix Trinity Modeling Cycle |
|||||||||||||||||||||||||||||||||||||||||
|
It is generally understood that the Relational Theory of Data is one of the cornerstones of the Shlaer-Mellor Method. Less appreciated is the role of Petri Nets.
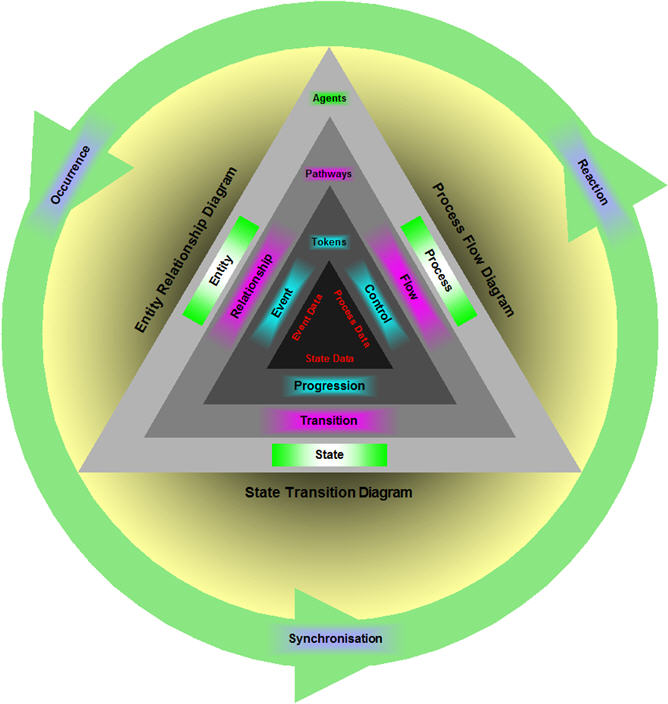
The Trinity of Modeling diagram sets out the underlying role played by Petri Nets in the notation and semantics of the Matrix Method. It also unifies the elements employed across all diagrams of analysis:
This synthesis is achieved by through equating elements in the notation to Petri Net components. Agents (Places in Petri Net terms) are the nodes in each diagram. Pathways (Arcs) are the static connections between Agents. Tokens are the discrete units of dynamic force which drive the modeling cycle. They may also carry data.
A modeling cycle is also identified where Tokens are transformed as they move from diagram to diagram. Typically, Tokens transform from Events to Progressions to Controls and back again to Events during the complete cycle.
The Trinity Modeling Cycle mainly concerns itself with the static aspects of the modeling method. The Event Transmutation Cycle
UML Notation Conversion
The Diagrams of Analysis
Each of the three diagram types: ERDs, STDs and PFDs employ one component drawn from the Agent, Pathway and Token groups:
In the diagram Petri Net components are interpreted as:
Agents - The nodes (Places) of all diagram types. The Agents are Entities, States and Processes. They are always named. Agents emit and consume tokens which are not conserved.
Pathways - The static routes (Arcs) between Agents along which tokens travel. The Pathways are Relationships, Progressions and Flows. Only Relationships and Progressions are named.
Tokens - These travel from Agent to Agent along Pathways and represent movement in time. The Tokens are Events, Progressions and Controls. Only Events are named.
Perhaps the most obvious example of how Petri Nets manifest themselves is found in the State Transition Diagram where the life cycle of objects are described as Finite State Machines.
Process Flow Diagrams with their control and data flows can also be seen to work as Petri Nets. However, the similarity of an Entity Relationship Diagram to a Petri Net is not so clear and this is explained in more detail below.
Events and Relationships
The idea that Events travel along Relationships may not be immediately apparent. This is perhaps because it seems Events can be sent to any Entity from any Entity without restriction (which is not entirely true) or it’s simply down to the fact that Entity Relationship Diagrams do not show Events.
However, when an Event moves from one Entity object to another it must possess the identity of the target object.
In order for the source object to obtain the target object's identity it must typically navigate a route using a series of intermediate Entities and Relationships to the target object. It is only when the source object has obtained the target object's identity via the Pathways the Event can be sent.
It is possible to draw a diagram showing Entities and Events and some notations provide diagrams for this purpose. However, this type of diagram can be derived from State Transition Diagrams so it’s not a first-class artefact.
The Modeling Cycle
Relevant happenings and occurrences in the Real World cause context crossing Events to enter and leave the model. Internally, Events are Tokens that represent interactions between Entities on the Entity Relationship Diagram.
On entering an Entity, an Event is transformed into a Progression which is shown on a Transition in the State Transition Diagram. On this diagram, Progressions synchronise the model's response between the Entities.
Similarly, on entering a Process Flow Diagram a Token is transformed from a Progression to a Control Token. The work required to implement the model's reaction is specified by Processes which route Control Tokens. Processes may also generate context crossing Events and further internal Events to Entities within the model.
In addition to its inherent control property, a Token may be defined to carry data items. As the Token moves from an ERD to STD to PFD and back to an ERD, the data part is renamed. Events carry Event Data, Progressions carry State Data and Controls carry Process Data. |
|||||||||||||||||||||||||||||||||||||||||
|
|
|||||||||||||||||||||||||||||||||||||||||
| Copyright © 2017 Dark Matter Systems Ltd. All Rights Reserved. | |||||||||||||||||||||||||||||||||||||||||
|
|
|||||||||||||||||||||||||||||||||||||||||